Marketing Operations — Part 2: Data & Analytics
Identifying the right data points, consolidating them across systems, building meaningful dashboards and enabling smarter decisions through reporting and forecasting.
Originally published on LinkedIn
Marketing operations goes far beyond managing tools or defining internal workflows. In Part 1, I outlined how marketing operations supports the team through process design, campaign enablement, and tech stack management.
In this second part, we’ll dive into one of the core data responsibilities of Marketing Ops: identifying and capturing the right data points, consolidating them across systems, building meaningful dashboards, and enabling smarter decisions through reporting and forecasting.
Let’s dive in.
The 5 pillars of Marketing Operations
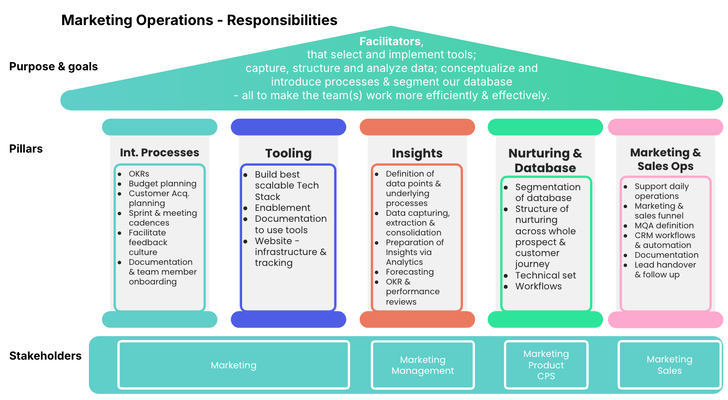
Insights: Data & Analytics
When people think of marketing operations, this is often what comes to mind first: dashboards, KPIs, and reporting. While it’s only one piece of the puzzle, it’s undeniably critical.
The role of data & analytics within marketing operations includes:
- Defining the critical data points you want to track
- Building the underlying processes to capture them
- Extracting and consolidating relevant data
- Preparing insights and marketing performance reports
- Forecasting demand
- Facilitating OKR and performance reviews
Define critical data points & build the underlying processes
(Yes, cookies and UTMs are becoming more restricted—but that doesn’t mean you give up on data.) Today’s technologies still allow us to track a wide range of user interactions: clicks on ads, website behavior, content engagement, and more. But tracking everything doesn’t mean you’re tracking what matters.
Before diving into tool configurations, start by getting clarity on what you actually want to measure—and why.
Ask yourself and your team:
- What are the KPIs we want to measure?
- Which insights should we be able to derive regularly?
- What should our marketing funnel look like from lead to revenue?
- How do we define a "campaign" in our CRM, and how do we measure its impact?
- Which attribution model fits our customer journey and buying process best?
- How do we use UTM parameters—and where do they fall short?
- Which fields and objects need to be created in our CRM/marketing automation system to enable this?
Only once these questions are answered should you move to implementation—together with your CRM admin, Sales Ops, and other stakeholders. This foundation will ensure that the data you collect actually supports strategic decision-making.
And a reminder: this isn’t a one-time project. As your business grows and changes, your processes and data requirements will evolve. A mature marketing operations function regularly revisits and adapts its data model and analytics stack.
Capture, Extract & Consolidate the Right Data
Before you can build shiny dashboards and slice KPIs with ease, you need to prepare your data properly. That means creating the right structures before jumping into visualization tools. Here’s a real-world-style example to illustrate the order of operations:
Let’s say you want to measure how many customers were acquired through third-party referral pages.
- Define your tracking process: Start by establishing how you’ll capture referral data. This includes defining the right UTM parameters for referral partners and creating the necessary data fields or objects in your CRM to store that information reliably.
- Implement & validate the process: Work with your operations or CRM team to implement the tracking logic and make sure it's working as expected. This may involve creating automation rules, validation criteria, or even enrichment steps.
- Extract and connect the data: Once you have a clean stream of data coming in, you can begin extracting the relevant data tables. Often, you’ll need to stitch together data from multiple sources—like combining UTM data from your website with revenue data from your deal pipeline or finance system.
- Now, you’re ready for analytics tools: Only at this stage should you bring in an analytics layer like Tableau, Looker, or Power BI. Without clean, connected data beneath the surface, your dashboards won’t be trustworthy—or useful.
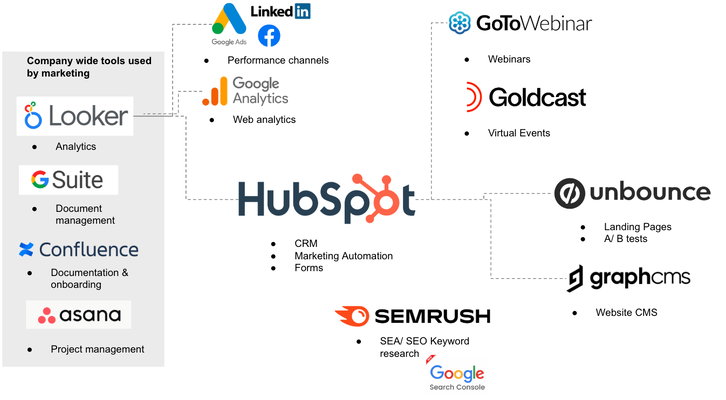
Marketing Tool Stack & Data Flow into Analytics tool
Getting to this point requires a strong understanding of how your data flows through your systems. You'll often need to collaborate closely with a data analyst or data scientist to ensure formats match, joins make sense, and your metrics reflect reality.
But once you’ve laid this foundation, that’s when the fun begins—uncovering actionable insights, identifying trends, and helping your marketing team (and leadership) make smarter, faster decisions.
Prepare Marketing Insights via Analytics & Reporting
If you've successfully built a dashboard that runs without errors and delivers the insights you were looking for, congratulations—this means the foundational steps we discussed above (data definition, capture, extraction, and consolidation) have been executed well.
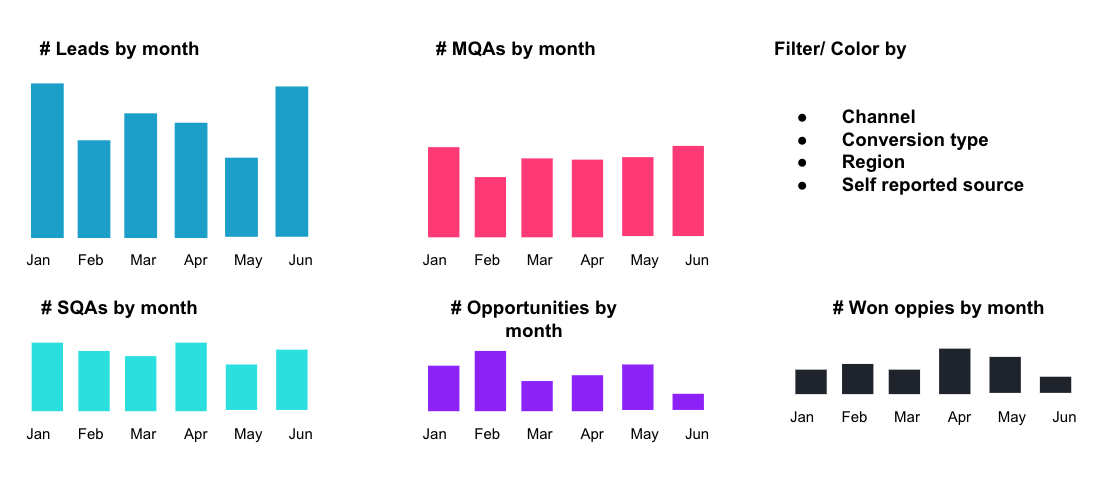
Now, one of the most frequent questions I hear is: “Which KPIs should I track?” This is a deep topic—one I plan to dedicate a full article to soon. But here’s a high-level overview of the metrics I believe every B2B SaaS marketing team should monitor and report on:
Funnel Metrics (Marketing-Sourced & -Influenced)
Track the number of MQAs, SQAs, Opportunities, and Customers over time, and break them down using dimensions like:
- Self-reported source
- Marketing channel (via UTM)
- Conversion type (e.g. Event, Demo, Webinar, Free Trial, etc.)
- Region, Country, ICP etc.
Funnel Metrics Marketing Dashboard
Funnel Metrics by Cohort
Monitor how key funnel stages perform across cohorts that matter to your business. Suggested cohorts:
- Monthly cohorts (to spot trends over time), Channel cohorts (to evaluate performance by source) & Conversion-type cohorts (to compare entry points)
Conversion Rates
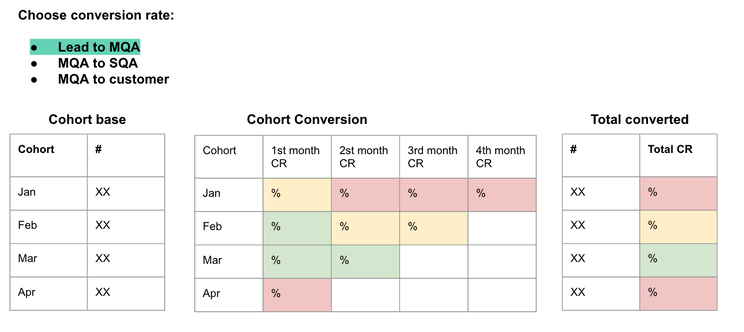
Conversion rates are the backbone of funnel performance. Tracking how leads move from one stage to the next not only highlights where your marketing is driving value—but also reveals where internal handovers, qualification criteria, or nurturing processes need refinement.
- Lead → MQA (nurturing effectiveness), MQA → SQA (quality + sales alignment), MQA → Customer (pipeline-to-revenue performance)
Cohort Conversion Rates Marketing Dashboard
Website Performance
Your website is often the first touchpoint with your brand—so understanding how it performs is critical. These metrics help you evaluate both reach, engagement with your content and CRO potential efficiency.
- Branded vs. unbranded (organic) traffic over time (by source/ medium etc.)
- Conversions by source/ medium etc.
- Session, Time on page and conversion rates at key conversion points & key pages
Brand Health
Brand metrics are powerful indicators of well your brand is known in the market and how your (brand) marketing efforts are paying of. They won’t always show up in attribution models—but they’re often the leading signals of demand creation.
- Branded search volume over time
- Follower growth on key social platforms
- Engagement with organic posts (likes, comments, shares)
Campaign Reporting
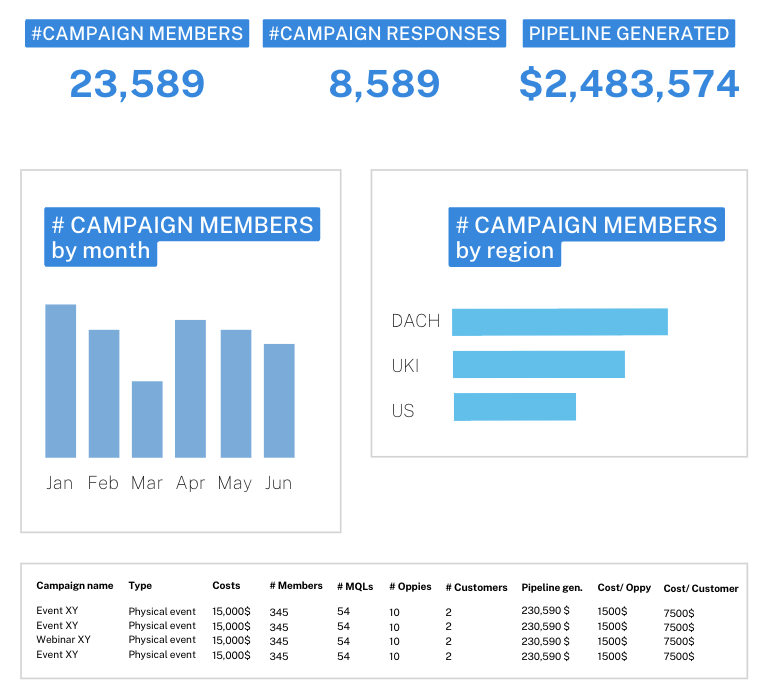
To understand what’s working and where to scale, you need visibility into full-funnel performance at the campaign level. This dashboard should consolidate efforts across teams and channels.
- Track MQAs, SQAs, Opportunities, Customers, and ROI per campaign, across all involved channels.
Campaign Marketing Dashboard
Free Trial Experience
If you offer a product-led motion (e.g. free trial or freemium), tracking user behavior post-signup is essential. It helps connect marketing efforts to product activation and customer success.
- Total signups
- Number of logins
- Users reaching key success moments
Database Health
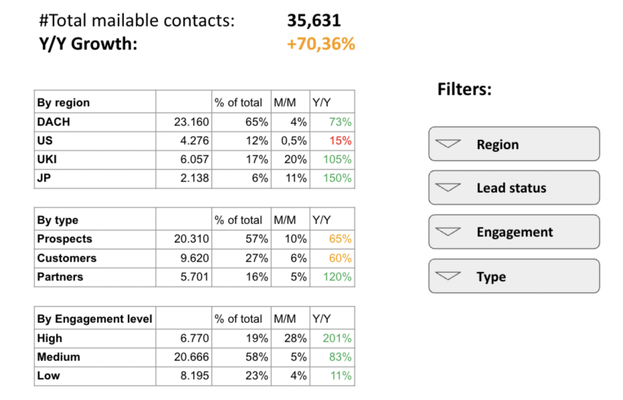
Your database is your long-term growth asset. Monitoring how it evolves helps you maintain quality, identify risks (like high opt-out rates), and tailor segmentation strategies (more on this in my article on database marketing).
- Growth and quality of mailable contacts
- Opt-out trends over time
- Breakdown by key dimensions (e.g. persona, region, industry)
Database Marketing Dashboard
This combination of KPIs gives you a clear picture of:
- How your marketing efforts are developing overall
- How cohorts, channels, and campaigns compare
- How both brand-building and demand generation activities are tracking
A Note on Reporting Cadence & Focus
Create a consistent reporting rhythm. I recommend:
- Monthly updates (for ongoing performance monitoring)
- Quarterly deep-dives (for strategic adjustments)
That said—don’t overanalyze. It’s easy to fall into the trap of reporting for reporting’s sake. Dashboards don’t create demand—actions do. Analytics should serve your strategy, not paralyze it.
Be Cautious with Attribution Tools
I fully agree with Chris Walker’s argument: Attribution software often overemphasizes measurable, bottom-of-funnel demand capture activities—and ignores or undervalues the harder-to-measure but crucial top-of-funnel demand generation efforts like podcasts, video content, and dark social.
So: be cautious about relying too heavily on attribution models alone. Combine what you see in tools with:
- Self-reported source data
- Insights from customer and sales conversations
- Your own strategic gut feeling as a marketer
Because sometimes, what can’t be measured is exactly what’s driving the most impact.
Wrapping it Up – and What’s Next
Marketing Operations is much more than tools and tracking—it’s the strategic enabler of modern B2B marketing. When built right, it connects strategy and execution, aligns marketing with sales, and drives efficiency through data and process.
So far in this two-part series, we’ve covered:
- Defining internal marketing processes
- Managing the marketing tech stack
- Structuring analytics & reporting
- Building forecasts to support alignment with sales
In Part 3, we’ll explore a set of topics that further round out the Marketing Operations function as your company matures. Among them:
- Nurturing & Database Marketing: segmentation, workflow structure, and ownership models
- Collaboration with Sales Operations: how to align funnels, define MQAs, and build lead handover processes
- Team & Talent: what roles you need at different stages, from the all-rounder early on to specialized functions like marketing analytics or automation
- Budgeting & Spend Visibility: how to structure and manage marketing budgets for accountability and strategic planning
- Where Marketing Ops should sit: pros and cons of being part of Revenue Operations versus operating as a standalone team within Marketing
These areas—while sometimes owned by adjacent teams—are all crucial for scaling your demand engine in a sustainable and data-driven way.
I hope you enjoyed the read. If you’re looking to build data-driven marketing foundations or need help designing dashboards that actually support decision-making—feel free to reach out.
Follow me or Kevin Probst here on LinkedIn for more insights on B2B SaaS go-to-market and what we’re learning along the way.
We are helping early to mid-stage startups grow with clarity, purpose, and soul. We build scalable GTM systems, align teams around the customer journey, and set up the tools, processes, and reporting needed to scale without chaos. We're not just consultants—we're builders, storytellers, and partners in both business and personal growth.
This article was originally published on LinkedIn. Read the original version, leave a comment or share it directly from there:
View on LinkedIn